Google Earth Engine Python Interface: Accessing and Analyzing Geospatial Data
Introduction
Google Earth Engine (GEE) is a powerful cloud-based platform designed for large-scale geospatial analysis. It provides access to a vast collection of satellite imagery and geospatial datasets, making it an essential tool for applications like environmental monitoring, urban planning, and scientific research. With its Python API, researchers and developers can seamlessly access, process, and analyze geospatial data, enabling efficient and scalable solutions. In this assignment, we explored the fundamentals of GEE, set up the Python API, and demonstrated how to load and visualize satellite imagery, including Landsat 8 and Sentinel-2.
Installation and Setup
- Set up a Google Earth Engine Account:
- Visit the Google Earth Engine website and sign up.
- Once approved, activate the Python API.
- Visit the Google Earth Engine website and sign up.
- Set up a Google Cloud Project:
- Go to the Google Cloud Console.
- Ensure that the Earth Engine API has been enabled for the project.
- Note your Google Cloud project ID. (ee-c004)
- Go to the Google Cloud Console.
- Install the Python API:
pip install earthengine-api
- Authenticate:
import ee
ee.Authenticate()
ee.Initialize(project='your-project-id')  # actual project ID : ee-c004
Key Features of Google Earth Engine
- Access to Vast Geospatial Data – Includes satellite imagery, climate data, elevation models, and more.
- Scalable and Fast Processing– Uses Google’s cloud infrastructure to handle large-scale geospatial analysis efficiently.
- Advanced Geospatial Tools – Supports filtering, mapping, statistical operations, and custom algorithm development.
- Seamless Python Integration – Works smoothly with libraries like Folium, and Pandas for enhanced analysis and visualization.
Code Examples
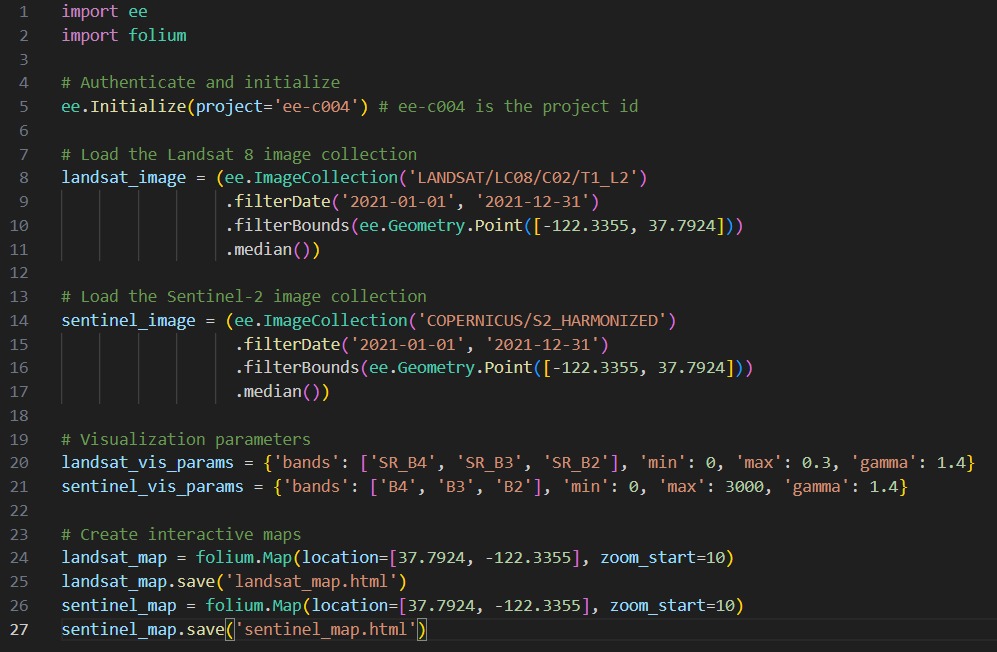
Loading and Visualizing Landsat 8 and Sentinel-2 satellites
import ee  # Google Earth Engine API
import folium  # For creating interactive maps

# Authenticate and initialize
ee.Initialize(project='ee-c004') # ee-c004 is the project id

# Load the Landsat 8 image collection
landsat_image = (ee.ImageCollection('LANDSAT/LC08/C02/T1_L2')
                 .filterDate('2021-01-01', '2021-12-31')
                 .filterBounds(ee.Geometry.Point([-122.3355, 37.7924]))
                 .median())

# Load the Sentinel-2 image collection
sentinel_image = (ee.ImageCollection('COPERNICUS/S2_HARMONIZED')
                  .filterDate('2021-01-01', '2021-12-31')
                  .filterBounds(ee.Geometry.Point([-122.3355, 37.7924]))
                  .median())

# Visualization parameters
landsat_vis_params = {'bands': ['SR_B4', 'SR_B3', 'SR_B2'], 'min': 0, 'max': 0.3, 'gamma': 1.4}
sentinel_vis_params = {'bands': ['B4', 'B3', 'B2'], 'min': 0, 'max': 3000, 'gamma': 1.4}

# Create interactive maps
landsat_map = folium.Map(location=[37.7924, -122.3355], zoom_start=10)
landsat_map.save('landsat_map.html')
sentinel_map = folium.Map(location=[37.7924, -122.3355], zoom_start=10)
sentinel_map.save('sentinel_map.html')
Performing NDVI Analysis
# Define a region of interest
roi = ee.Geometry.Rectangle([-122.45, 37.70, -122.20, 37.85])

# Calculate NDVI for Landsat 8
landsat_ndvi = landsat_image.normalizedDifference(['SR_B5', 'SR_B4']).rename('NDVI')

# Calculate NDVI for Sentinel-2
sentinel_ndvi = sentinel_image.normalizedDifference(['B8', 'B4']).rename('NDVI')

# Reduce region to get mean NDVI
landsat_mean_ndvi = landsat_ndvi.reduceRegion(reducer=ee.Reducer.mean(), geometry=roi, scale=30)
sentinel_mean_ndvi = sentinel_ndvi.reduceRegion(reducer=ee.Reducer.mean(), geometry=roi, scale=30)

print('Landsat 8 NDVI:', landsat_mean_ndvi.getInfo())
print('Sentinel-2 NDVI:', sentinel_mean_ndvi.getInfo())
Screenshots
Loading and Visualizing Landsat 8 and Sentinel-2 satellites
Performing NDVI Analysis 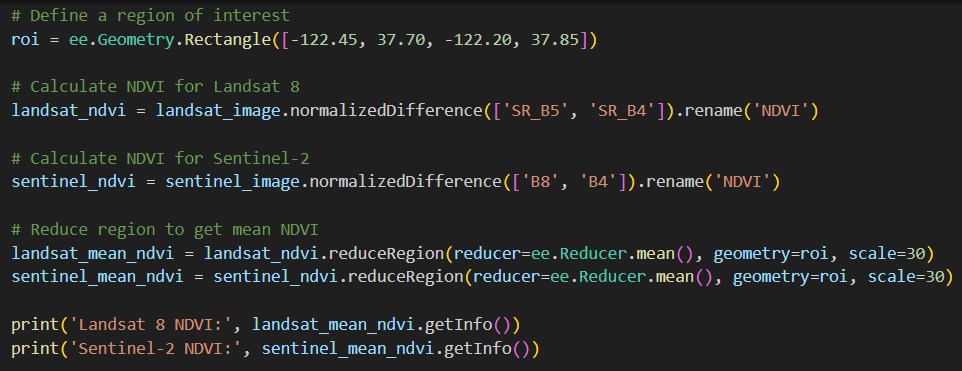
Observation from Landsat 8 Satellite

Observation from Sentinel-2 Satellite 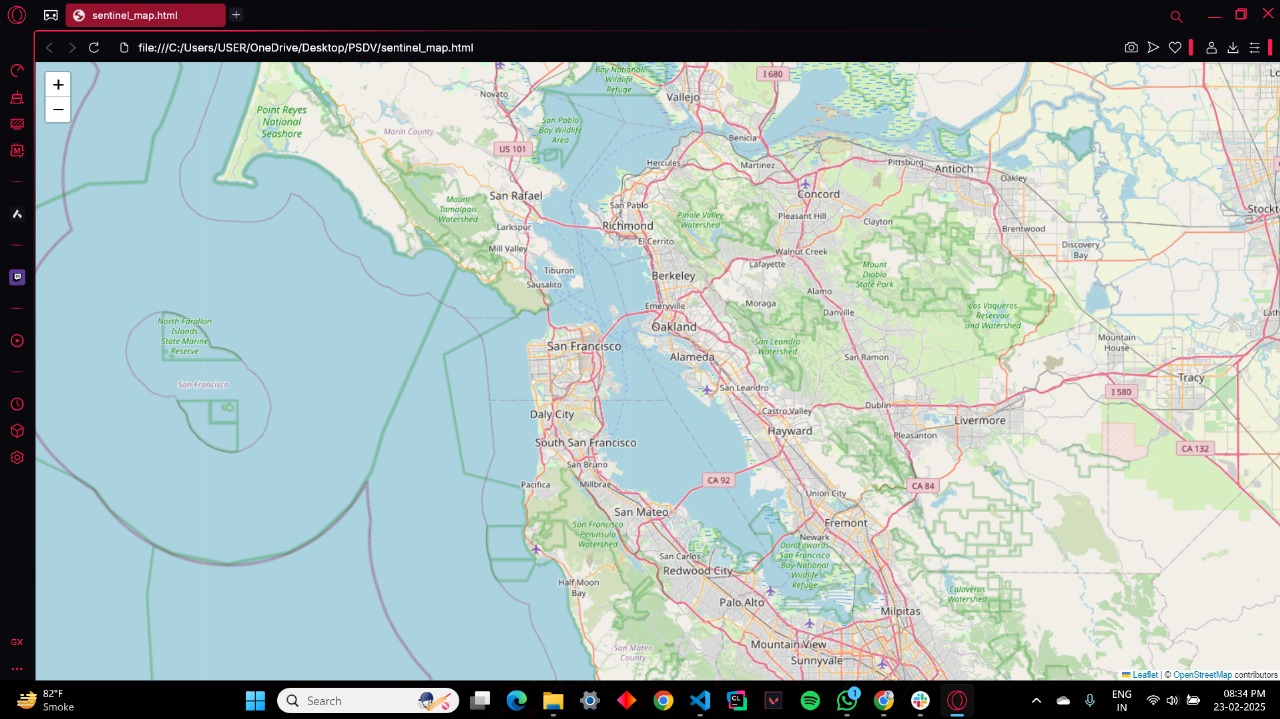
Output Terminal 
Use Cases
- Tracking Environmental Changes – Monitor deforestation, assess water quality, and analyze shifts in land cover to understand ecosystem changes over time.
- Disaster Management and Response – Evaluate the impact of floods, track the spread of wildfires, and monitor drought conditions to support early warnings and recovery efforts.
- Urban Growth and Planning – Study how cities expand, identify areas affected by heat islands, and analyze infrastructure development for better urban planning.
Conclusion
The Google Earth Engine Python API makes accessing, processing, and analyzing large-scale geospatial data easier. It is a valuable tool for environmental scientists, urban planners, and researchers studying changes in Earth’s landscape.